
9/21 EMA Crossover Signals
Identifies bullish and bearish trend changes when the 9 EMA crosses above or below the 21 EMA.
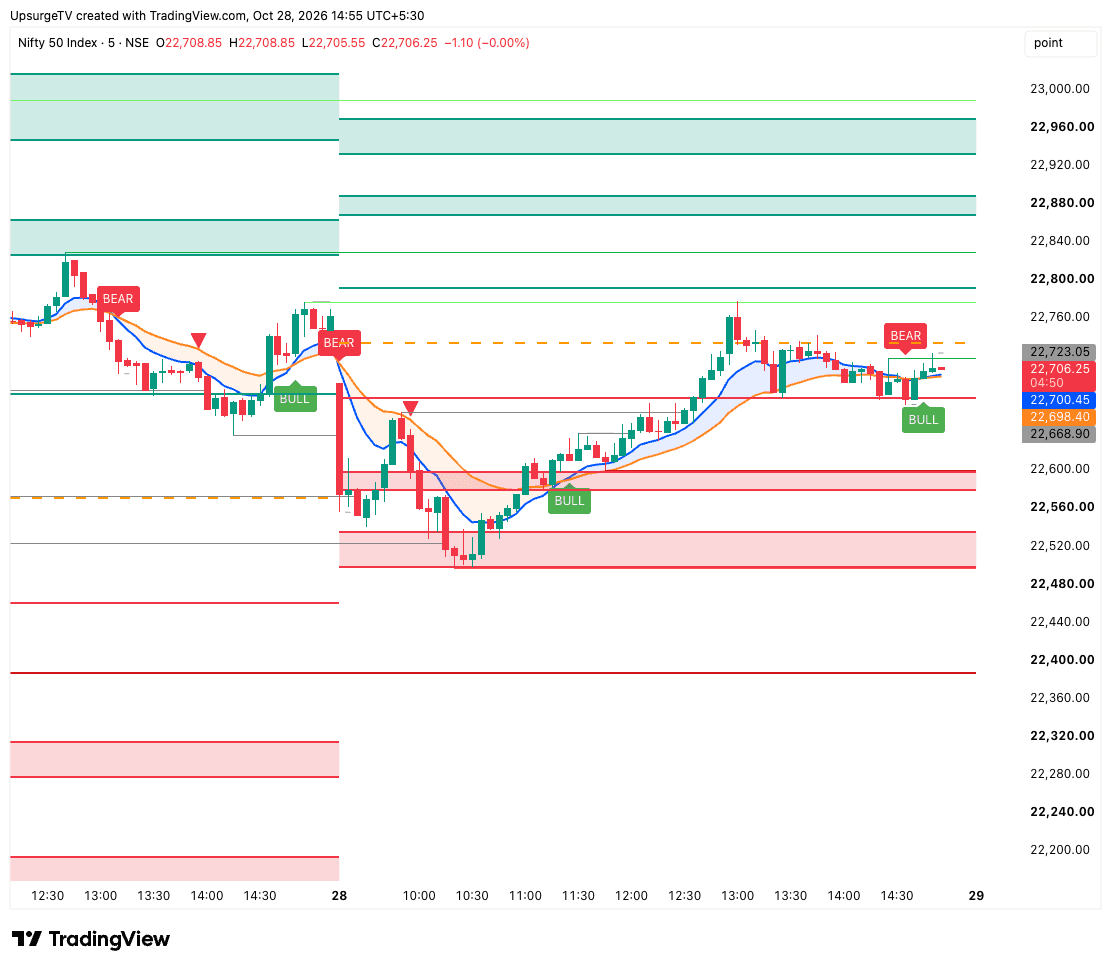
9/21 EMA Strategy by Trade Hunter is an all-in-one trend and price-action tool built around the 9 and 21 EMA crossover. It marks trend shifts, plots key swing breakout levels, gives pullback entry signals in the direction of the trend, and draws previous-day range levels, so you can plan entries, targets and key zones from a single indicator.
Win Rate
75%
Accounts using
2,346+
Indicator Access on
about the indicator
Four core modules that work together for a complete trading system
9/21 EMA Strategy by Trade Hunter is an all-in-one trend and price-action tool built around the 9 and 21 EMA crossover. It marks trend shifts, plots key swing breakout levels, gives pullback entry signals in the direction of the trend, and draws previous-day range levels, so you can plan entries, targets and key zones from a single indicator.

Identifies bullish and bearish trend changes when the 9 EMA crosses above or below the 21 EMA.

Automatically identifies significant swing highs and lows to plot potential support and resistance levels. Intermediate swing levels add further reference points, while touched or expired levels are managed automatically.

Identifies potential pullback entries after an EMA crossover, using moving-average touches and price-action confirmation. Buy and sell triangles mark qualifying setups on the chart.

Plots a central reference level and five upper and five lower levels derived from the previous day's high-low range. Coloured lines and shaded zones help traders map potential price reaction areas.
Note: Indicator can be accessed onIndicator can be accessed on
pricing
Get the indicator in your TradingCharts account.
₹399 /
Indicator Access
Indicator access in your TradingCharts (dhan) account
₹999 /
Indicator Access
Indicator access in your TradingCharts (dhan) account
getting started
A short walkthrough of getting the indicator onto your TradingCharts
Watch this video to understand the process
instructor
Learn from experienced market practitioners
Mr. Dhananjay Pawar renowned for his YouTube channel Trade Hunter, has over 96,000 subscribers. With more than 12 years of experience as a full-time trader, he has mentored hundreds of students.
faq
Everything you need to know before you get started