
Automatic Range Detection
Identifies tight consolidation zones and draws boxes around them.
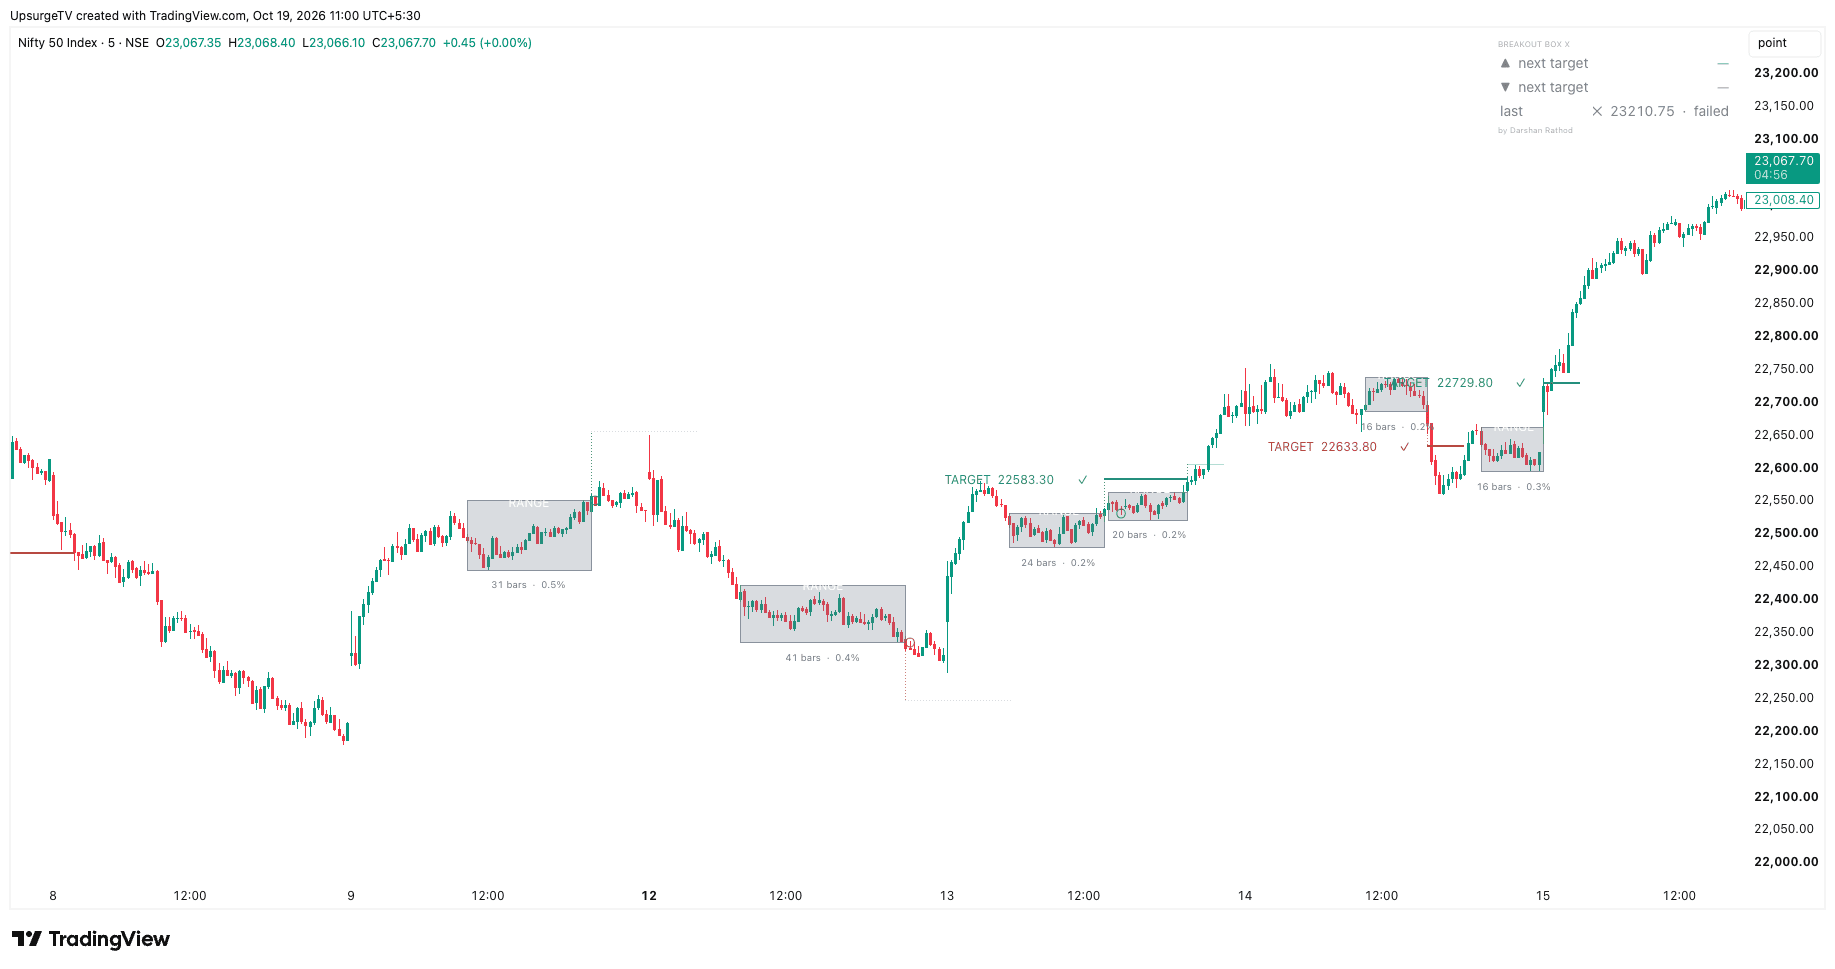
Breakout Box X finds tight sideways ranges where the market is building up energy, and draws a box around each one. When price breaks out, it automatically draws a target, tracks it, and ticks it ✓ when price reaches it.
Win Rate
70%
Accounts using
2,340+
Indicator Access on
about the indicator
Spot the Range. Catch the Breakout. Track the Target.
Breakout Box X finds tight sideways ranges where the market is building up energy, and draws a box around each one. When price breaks out, it automatically draws a target, tracks it, and ticks it ✓ when price reaches it.

Identifies tight consolidation zones and draws boxes around them.

Highlights potential long and short setups when a candle closes beyond the range.

Displays “IF UP” and “IF DOWN” levels to help plan both scenarios in advance.

Shows the duration and percentage height of each consolidation range.
Note: Indicator can be accessed onIndicator can be accessed on
pricing
Get the indicator in your TradingCharts account.
₹399 /
Indicator Access
Indicator access in your TradingCharts (dhan) account
₹899 /
Indicator Access
Indicator access in your TradingCharts (dhan) account
getting started
A short walkthrough of getting the indicator onto your TradingCharts
Watch this video to understand the process
instructor
Learn from experienced market practitioners
Darshan serves as the Director and COO of Multyfi (SEBI Reg. No. INH000013475) and brings more than 10 years of experience as a systematic trader, specializing in stock market fund management. Committed to educating and empowering traders, he regularly shares his insights across various platforms and has been featured on prominent news networks, including CNBC, News Capital, and India News.
faq
Everything you need to know before you get started